linux-debugging
Who is the guy talking?
Srujan Akumarthi
- DevOps at WebEngage.
- Responsible for systems going down but never responsible for them being staying up.
What’s Debugging in DevOps?
And why is it challenging?
- It’s part of your application lifecycle that doesn’t get covered in sprints, Agile, Scrum, etc.
- Something went Wrong. Something is not working. Something is slow.
- No self written code. Everything that we’re debugging, is actually part of some libraries, some kernel code or some developer written code.
But we don’t have luxury to do print statements.- Figure it all out when the house is on fire. You’ve 5 minutes!!
The scope of this talk is only about observability tools. Benchmarking, Tuning, Static config check tools are for some other day.
Usual Methods
- Street light.
I know few things. I’ll try to look only in those areas.
Staring at code until bug reveals itself. - Tune randomly.
Increase CPU, IOPS, Memory.. restart the service. It works! - Blame someone else.
When you’ve lot of connected components, you just go from app layer, database layer, network is bad, it’s raining at our data center in US. - Looking at dashboards.
This is something I follow reluctantly. If I’ve 100 different metrics on a server, which all dashboards do I look, before concluding anything?
Any of these methods might work sometimes, but don’t make it a practice.
Usual things
- Hey, my application is running slow. Why?
- Hey, my machines are at 100% cpu usage.. can you add more CPU cores?
- OMG! I’ve an out-of-memory error. Add more RAM!!
- It was working fine in staging, was working good under load testing.
- We were able to handle higher loads than this, why is this happening now?
Latency Numbers Every Developer Should Know
Tools
strace
- Lets you look at what’s your program is doing, without knowing anything about source.
- It prints out every system call made by your process.
Do not run on production.
Case Study:
Missing library. A python app called Sentry, a beautiful open source real time error tracker. Now, we’ve installed it in virtualenv and something is wrong. I did strace -e trace=open,read <pid> and foudn out that one of the libraries is being loaded from somewhere other than my env folder.
- Other usual cases I use strace for:
- Finding out where are my logs.
strace -e write - Which configuration file is it using.
strace -e open - Which network components is it connecting to?
- Finding out where are my logs.
uptime
Strace linux standard uptime and find out where is it getting data from!

Fun stuff to do: cat /proc/uptime, cat /proc/loadavg
dstat
It prints out how much network and disk every second.

Case Study:
Mysql is intermittently slow. Sniffing network packets, and monitoring for a while, can tell you what’s happening. In one scenario, recv has jumped to 455MB and mysql went slow. So, it’s a query! Now, we’ve a lead.. We can inspect further.
top/htop/atop
top is the first guy we look at.
Problem: Shortlived processes aren’t covered in top/htop..
atop got your back, though. It prints out short lived processes too.
Other cpu tools: mpstat, iostat
Fun exercise: Strace all these tools!
However, these tools can only go till process level. What if I have a tool which tells me which function in my program is using most of the CPU?
perf
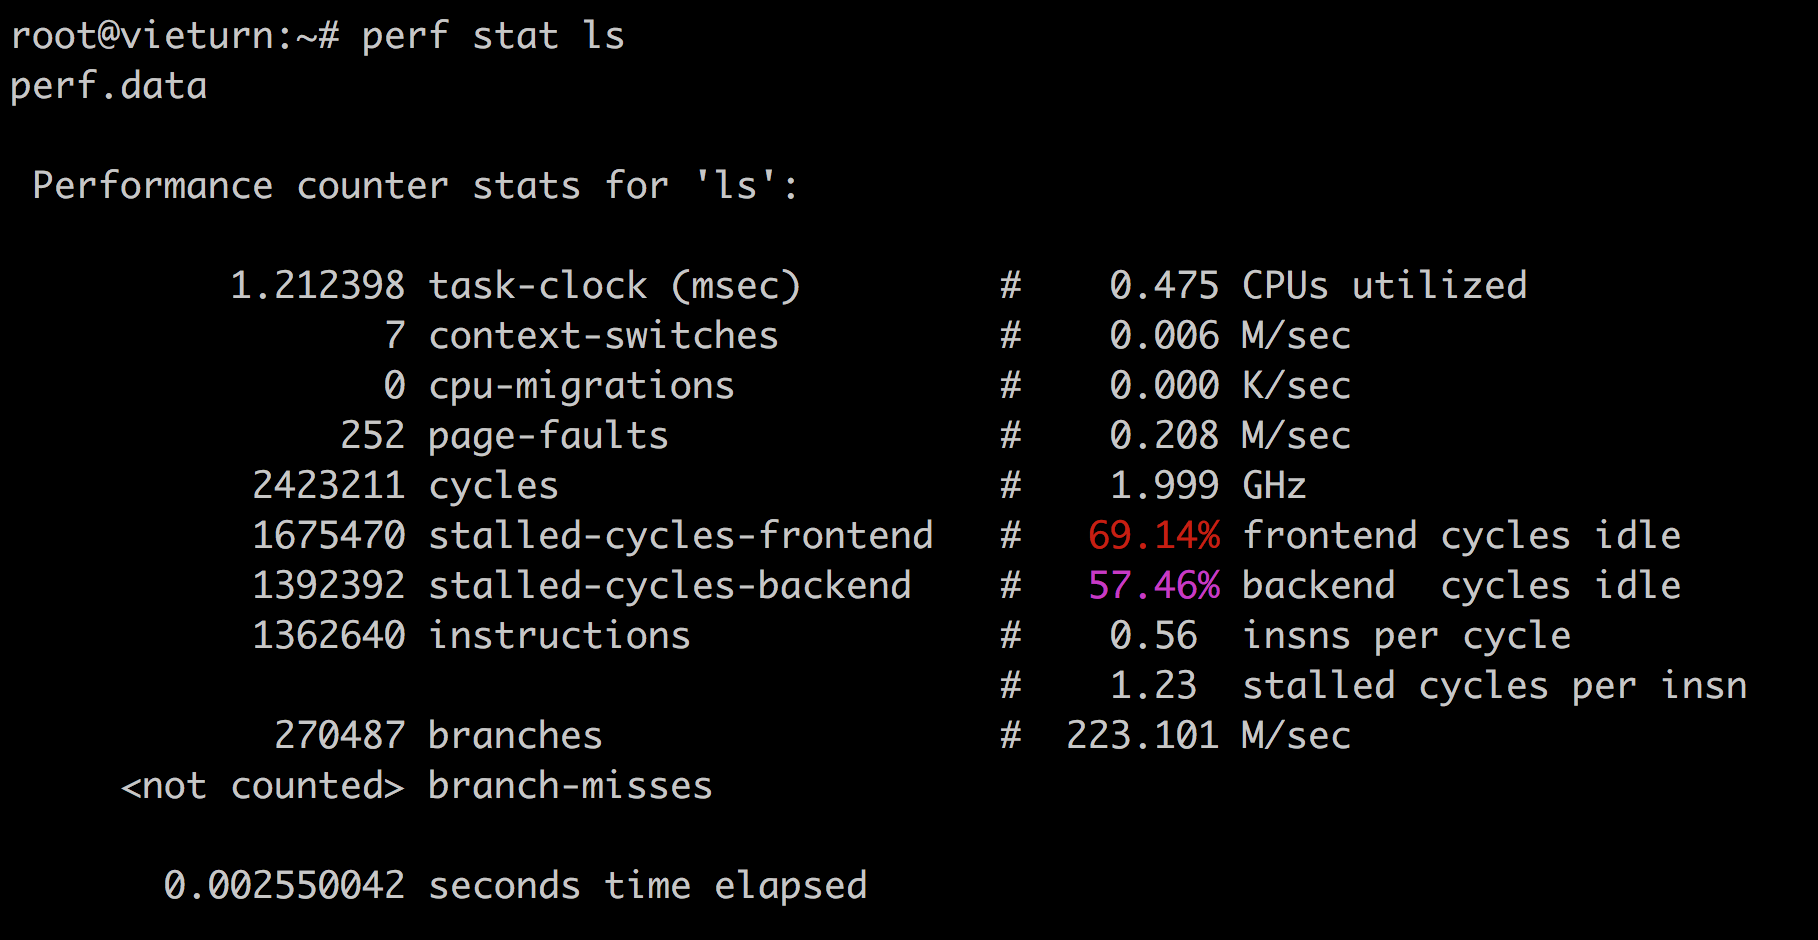
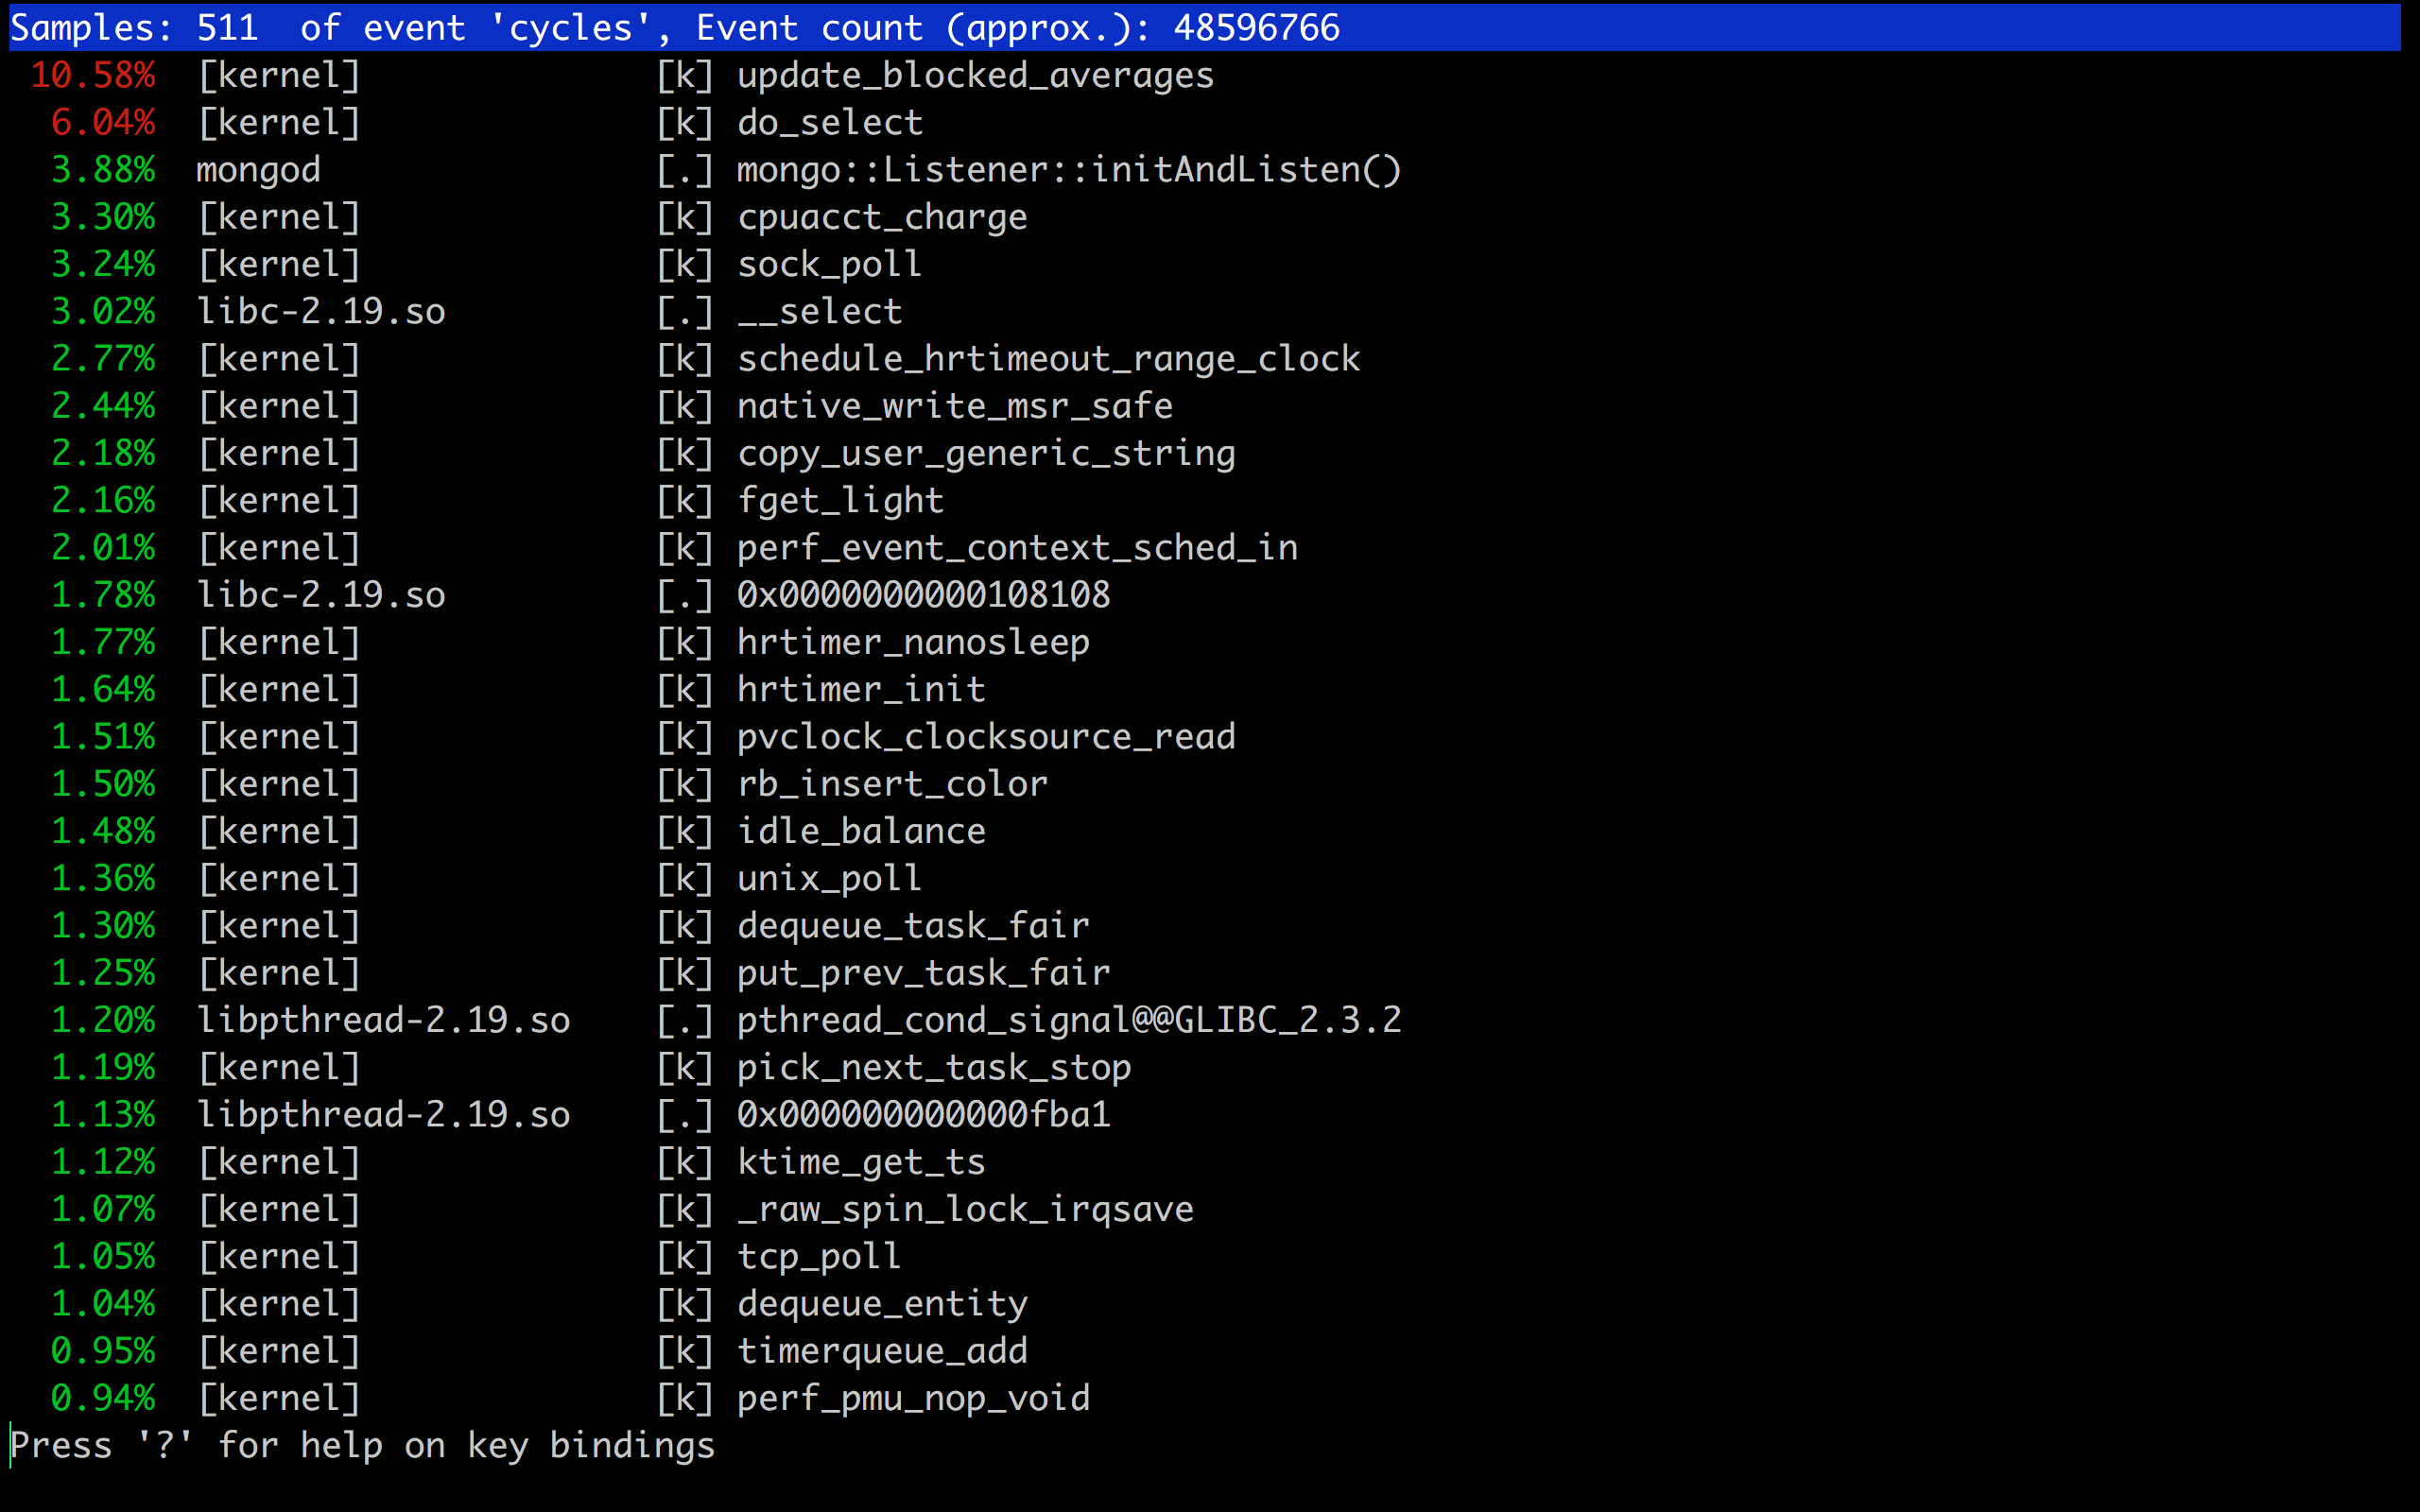
perf is an amazing tool! Does a lot! It’s a sampling profiler.
perf stat ls

perf top -p <pid>

Perf useful for java: https://github.com/jrudolph/perf-map-agent
- Perf flame graphs
Flame Graphs are interesting way to look at perf reports. Because perf reports can be long!
opensnoop/execsnoop/iolatency.
opensnoop traces open() syscalls, showing the file name and returned file descriptor.

This is part of an army called perf-tools
Isn’t this same as strace -e open?? Yes. However, strace freezes every system call, prints it to output, unfreezes it. While opensnoop does it without freezing system calls.
Fun Stuff to do:How do we know this? strace strace, strace opensnoop Reading source code should help you better.
telnet
Quickly find out if firewall is the issue. telnet <host-ip> <port>
Till date, I found it useful only for this, in debugging.
netstat
Print network connections, routing tables, interface statistics, etc. I use it mostly to find out how many connections from each host are there currently on my server.
It’s simple to use! netstat -tunapl and grep desired stuff.
Something like this is helpful one-liner.
netstat -antu | grep :80 | grep -v LISTEN | awk '{print $5}' | cut -d: -f1 | sort | uniq -c | sort -rn
lsof
Tells what files are opened by what processes.
Classic case of disk space
df -h shows 100% disk usage. du -sh / tells other tale. Is linux lying?
Not actually. lsof +L1 tells that you’ve few files , but your filesystem has a pointer to it. So, it’s part of filesystem space.
How to reclaim? Restart process, to release deleted files.
In general, avoid deleting a file currently held by process. If you want to reclaim space, and keep the file intact echo > filename
Widely, we’ve these tools doing either of sampling profilers, trace system calls.
Basic
Basic tools:
- top, htop, atop, ps, mpstat, free, vmstat, iostat, netstat
Intermediate
Somewhat unpopular and difficult to articulate.
- strace, dstat, tcpdump, nicstat, pidstat, swapon, lsof, sar
Advanced
Too specific and requires some knowledge about linux kernel.
- ltrace (trace library calls of the function), ss (socket inspection tool), ethtool, blktrace (traces of i/o traffic on block devices), slabtop, tiptop, pcstat and many more!
Fun and Important Stuff: Which one is used by your monitoring system? Nagios, Sensu, Newrelic, Datadog, etc.. somehow use the same underlying functions.
A lot more under /proc
We’ve seen a lot of tools above. If you strace them all, you’ll find they’re opening /proc/ at one point or the other time. All the treasures are hidden here!
/proc/ is a directory in linux where all of your processes stay.
It has some folders under the hood. What I’d be most interested, in general, are limits and status. Sometimes, filedescriptors!
Few more cases:
git is slow!
We’ve our hosted gitlab server and it’s painfully slow for a few days.
Updated gitlab version a few days earlier, but is it really the reason?
Increased verbosity over git.
set -x; GIT_TRACE=2 GIT_CURL_VERBOSE=2 GIT_TRACE_PERFORMANCE=2 GIT_TRACE_PACK_ACCESS=2 GIT_TRACE_PACKET=2 GIT_TRACE_PACKFILE=2 GIT_TRACE_SETUP=2 GIT_TRACE_SHALLOW=2 git pull origin master -v -v; set +x
Found out ssh is slow. Turned on strace on sshd, on server during off work hours. Found out some obscure library call on systemd taking too long. Googled it around, and boom! There’s a linux patch yet to be merged. Lived with workaround for a couple of days, applied patch and everyone is happy!
Finding out this, would’ve been practically impossible with our basic tools like top, iotop, etc.
Postgresql is slow after about 2 million operations.
An obscure postgresql server that’s running painfully slow, after about 2 million operations. Usual suspects like CPU, RAM are calm. We restart the system (not just service!), and it works fine for 2 million more operations. Now, as it is production, we can’t run strace. Did some random unrelated tunings and expected it to work, it obviously doesn’t.
Finally did perf top and bunch of other things to find out something is awry with L1 cache.
Randomly DNS fails sometimes.
Yet to be debugged to the root level. I’m poor in networking! I’m sure it’s not difficult. I might have to do some tcpdump or so.
Curious case of Amazon CPU credits, I/O Burst credits.
We run out of them, quickly. And while we can have alerts to do some actions when they go out of credits, I was more keen on how the usage has been. To scale right in production, is a myth. We got to do everything related to profiling before hand, understand what resources my program is using, etc. and decide on what instance type, capacity to allocate.
Some of these might not be applicable for docker.
I tried to run strace inside a container for the first time, and it said permission denied. I’m gonna figure out why and update here.
Reference blogs to read more:
– Brendann Greg
– Julia Evans
– htop explained by Peteris